"How to Monitor High Load Systems - Metrics, Logs, and Real-Time Alerts")
How to Monitor High Load Systems: Metrics, Logs, and Real-Time Alerts
Designing a system capable of handling high traffic is only one part of high-load engineering. Once that system reaches production, engineers face a different challenge: understanding what is happening inside it while thousands of requests move simultaneously through application servers, caches, databases, message brokers, external APIs, and infrastructure components. A system that looked predictable during testing can behave very differently when it encounters real traffic patterns, sudden peaks, unusual user behavior, infrastructure failures, and frequent deployments.
In smaller applications, troubleshooting can still be relatively straightforward. A developer notices a problem, checks several logs, looks at server utilization, reproduces the issue, and eventually finds its source. This approach becomes increasingly unreliable as the architecture grows. A latency spike may originate in a database, a saturated connection pool, an overloaded worker, an external provider, or a cache that suddenly stopped serving most requests. By the time users report that the application feels slow, the original signal may already be hidden among millions of requests and log events.
Monitoring and observability therefore have to be treated as part of the architecture rather than as tools installed after development is complete. Infrastructure metrics show whether computing resources are approaching their limits, application metrics reveal whether users are receiving acceptable responses, logs provide the context necessary to understand failures, and distributed traces connect events across multiple services. When these signals are combined with useful dashboards and carefully designed alerts, teams gain the ability to recognize abnormal behavior early and investigate it without relying on guesswork.
The purpose of monitoring is not to collect the largest possible number of metrics. The real objective is to understand whether the system is healthy, how its behavior changes under load, where its practical limits are, and when engineers need to intervene. In this guide, we will examine the metrics that matter most for high-load applications, the role of logs and distributed tracing, how Prometheus, Grafana, Loki, OpenTelemetry, and cloud-native platforms fit into a monitoring stack, and how to design real-time alerts without overwhelming engineers with noise.
Monitoring and Observability Are Closely Related, but They Solve Different Problems
Monitoring is primarily concerned with questions that engineers already know they need to ask. A dashboard may show whether CPU utilization is increasing, whether an API is returning more errors than usual, whether database latency has exceeded an acceptable range, or whether a queue is accumulating messages faster than workers can process them. These are predefined conditions that can be measured continuously and compared with expected behavior.
Observability becomes particularly important when the question was not anticipated in advance. OpenTelemetry describes observability as the ability to understand a system's internal state through the telemetry it produces, including metrics, logs, and traces. In practice, this means engineers should be able to investigate unexpected behavior using existing telemetry rather than adding new instrumentation every time an unfamiliar production problem appears.
This distinction becomes more significant as architectures become distributed. A request may enter through a load balancer, pass through an API gateway and several services, query Redis, access a database, publish an event to a queue, and communicate with an external provider before a response reaches the user. A monitoring dashboard may correctly identify that latency has increased, but that information alone does not explain which component is responsible.
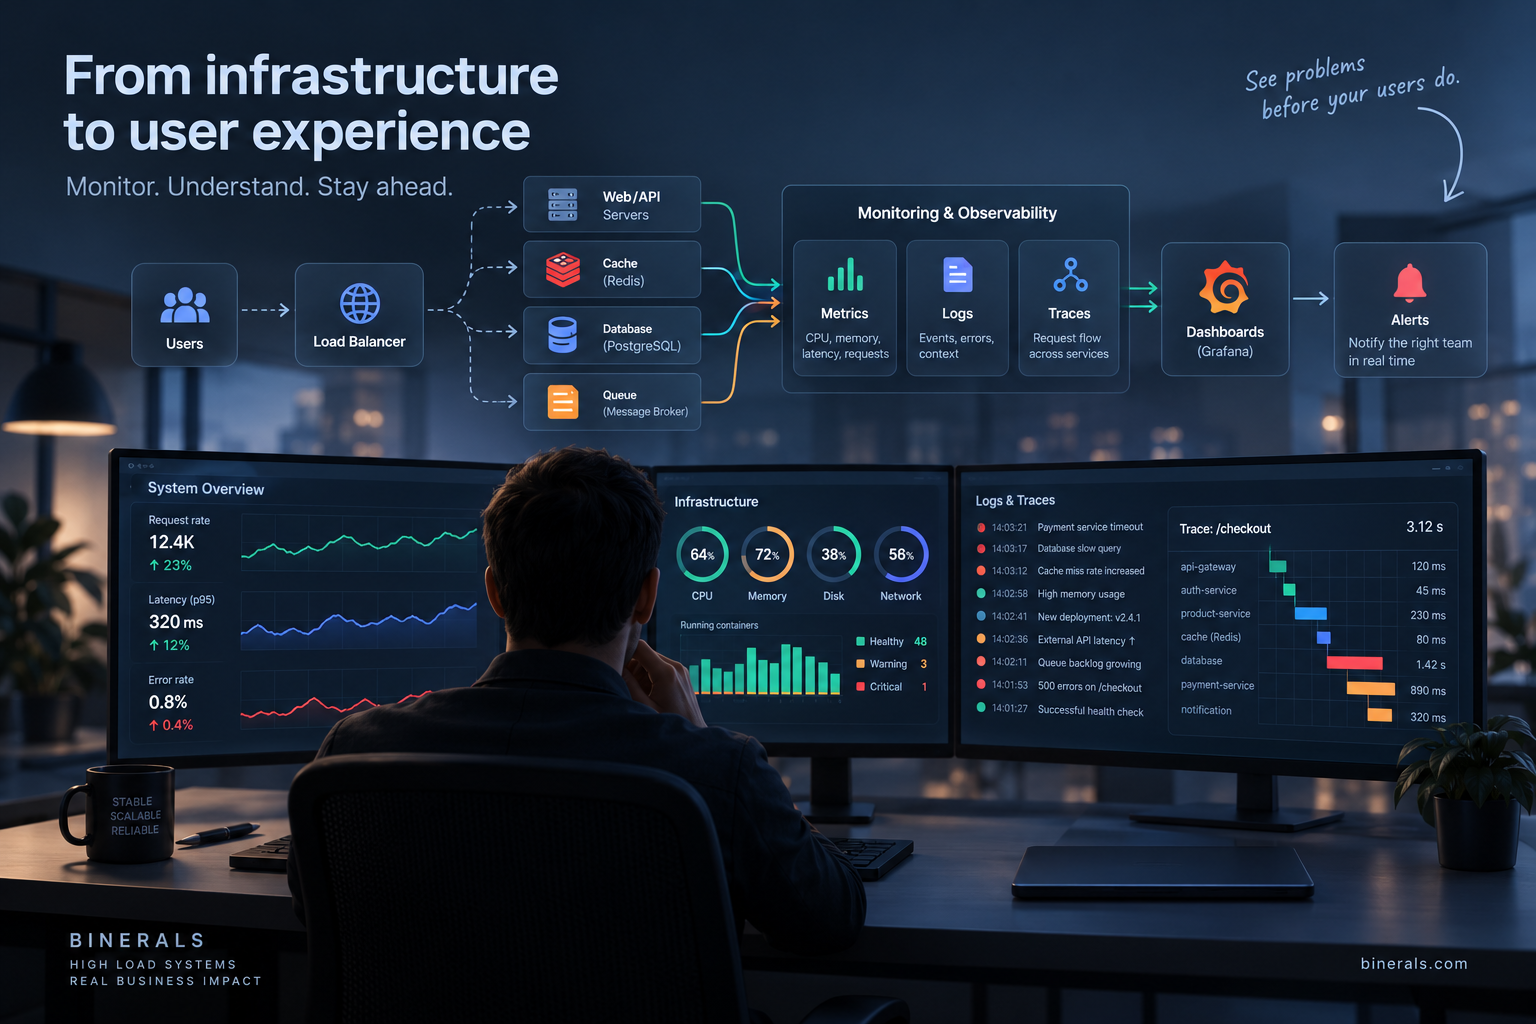
For this reason, mature high-load environments usually combine metrics, logs, and traces rather than relying on any one of them. Metrics make changes and trends visible across large volumes of activity. Logs preserve detailed context about individual events and failures. Distributed traces reconstruct the path taken by individual requests across services. Together, these signals allow engineers to move from noticing a problem to understanding its origin much more efficiently.
What Should You Monitor in a High-Load System?
One of the easiest mistakes in monitoring is assuming that more telemetry automatically creates better visibility. Modern infrastructure can expose thousands of measurements, and collecting all of them without a clear hierarchy often produces dashboards that are technically impressive but difficult to use during an incident.
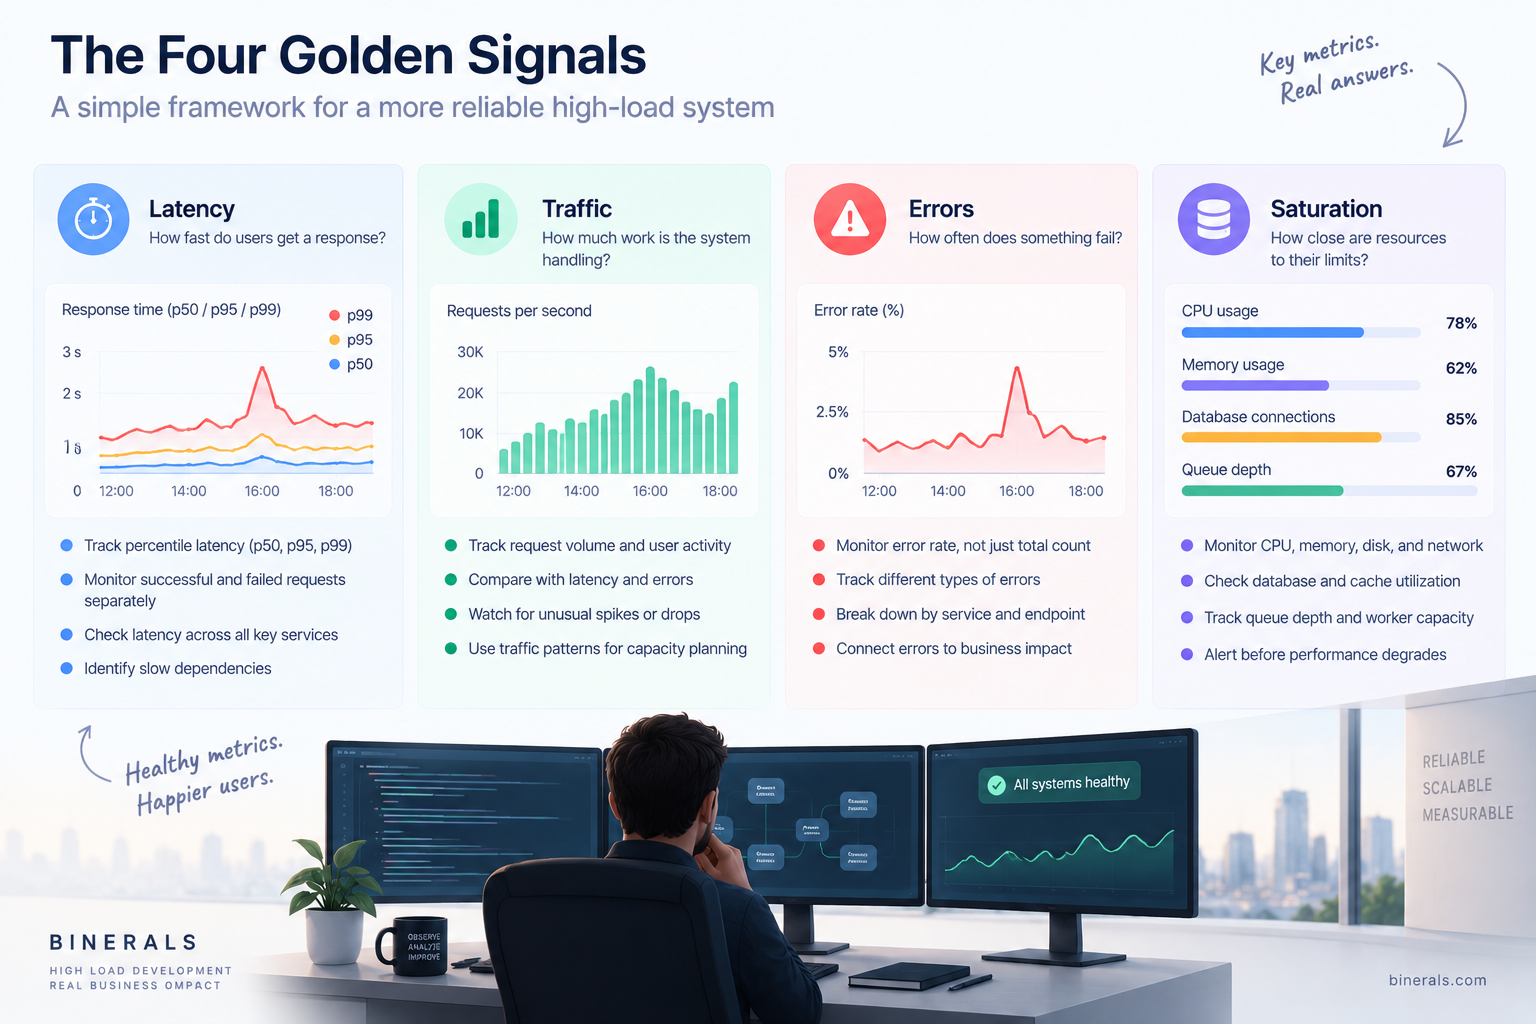
A better starting point comes from Google's Site Reliability Engineering framework, which identifies latency, traffic, errors, and saturation as the Four Golden Signals. Google recommends focusing on these signals when a team can monitor only a limited set of user-facing system metrics because together they describe how much work the system is handling, how quickly it responds, how often it fails, and how close it is to exhausting available capacity.
Latency Should Be Measured as a Distribution, Not Just an Average
Response time is one of the most familiar performance measurements, but averages can create a misleading picture of system health. If most requests complete quickly while a smaller but still significant group takes several seconds, the average may remain acceptable even though thousands of users are experiencing poor performance.
High-load systems therefore benefit from percentile-based latency measurements such as p50, p95, and p99. Median or p50 latency provides a useful indication of typical behavior, while p95 and p99 expose the slower end of the distribution where congestion, dependency problems, database contention, or other performance issues often appear first. Google SRE also recommends distinguishing successful requests from failed requests when measuring latency because an application returning an error almost immediately should not be interpreted as delivering excellent performance.
Latency should also be observed at more than one architectural layer. An API may respond slowly because its own application logic is inefficient, but it may also be waiting for a database query, an overloaded cache, or a third-party service. Looking at these measurements together helps teams distinguish between symptoms and underlying causes.
Need to scale your project seamlessly?
Binerals are ready to helpTraffic Provides Context for Every Other Metric
Traffic describes the amount of demand entering the system, although the correct measurement depends on what the system actually does. For an HTTP application, requests per second may be appropriate, while a messaging platform may care more about concurrent connections or messages per second. A transaction platform may track operations per second, while a data-processing service may focus on jobs, events, or files processed over time.
Traffic becomes especially useful when correlated with latency, errors, and infrastructure utilization. If request volume doubles while latency remains stable, the architecture is probably absorbing growth successfully. If traffic remains unchanged but CPU consumption and response times suddenly increase, the problem is more likely to be an application regression or an unexpected internal workload. If traffic rises sharply at the same time as CPU, queue depth, and p99 latency, the system may simply be approaching its current capacity.
This relationship is central to the principles described in our guide to high-load architecture. High traffic alone does not define whether a system scales well. What matters is how performance and reliability change as demand increases.
Error Rate Shows Whether the System Is Actually Delivering Its Function
Monitoring errors requires more than counting HTTP 500 responses. Failures in distributed systems can appear as application exceptions, dependency timeouts, rejected database connections, failed background jobs, queue processing errors, authentication problems, cache failures, exhausted retries, or unsuccessful calls to external services.
Absolute error counts can also be misleading when traffic varies substantially. One hundred failed requests during a period containing one million successful requests represent a very different reliability problem from one hundred failures among five hundred total requests. Monitoring error rates as a percentage of relevant operations provides much more useful context as traffic changes.
Teams should also distinguish between different classes of failure. A validation error caused by incorrect user input does not have the same operational significance as a database timeout. Likewise, an optional recommendation service failing may not deserve the same severity as checkout or authentication becoming unavailable. Monitoring becomes more useful when technical errors are connected to the business functions they affect.
Saturation Tells You How Close the System Is to Its Practical Limit
Saturation describes how much capacity remains before a resource or service begins to degrade. CPU utilization and memory pressure are obvious examples, but saturation can also appear in database connection pools, thread pools, queue consumers, network throughput, disk I/O, storage capacity, or worker utilization.
A common mistake is assuming that a resource becomes problematic only when utilization reaches 100 percent. In reality, many systems start showing degraded latency well before reaching their theoretical maximum capacity. Google SRE specifically recommends monitoring both current utilization and the practical limits beyond which performance begins deteriorating.
This makes saturation metrics particularly important when applying the strategies discussed in our article about vertical and horizontal scaling. Scaling decisions should ideally be driven by measurable capacity pressure rather than by assumptions about when infrastructure might eventually become overloaded.
Binerals High-Load System Development can help design monitoring and reliability into the architecture from the start.
Contact usCPU and Memory Matter, but They Cannot Describe System Health Alone
CPU and memory utilization are often the first measurements engineers add to infrastructure dashboards because they are easy to collect and intuitively understandable. They remain important, but interpreting them without application context can lead teams in the wrong direction.
A server operating at 85 or 90 percent CPU may be functioning perfectly well if requests continue meeting latency and reliability targets. At the same time, another server may use only 30 percent of its available CPU while users wait several seconds because requests are blocked by a database lock or an exhausted connection pool. Infrastructure utilization and user experience are connected, but one cannot be used as a complete substitute for the other.
CPU becomes much more informative when viewed alongside traffic and latency. Increasing traffic accompanied by proportionally higher CPU utilization and stable response times may simply demonstrate that the system is using available resources efficiently. Increasing CPU and latency while traffic remains unchanged can instead indicate a software regression, inefficient deployment, unexpected background workload, or other abnormal behavior.
Memory should be interpreted in a similarly contextual way. Teams should watch not only the percentage of allocated memory but also long-term growth patterns, garbage collection behavior where applicable, swapping, container limits, and out-of-memory events. A slow but persistent increase in memory consumption may reveal a leak hours or days before the affected process finally crashes.
Disk I/O, available storage, network throughput, open connections, and packet loss can become equally important depending on workload characteristics. The objective is therefore not to choose between infrastructure and application metrics, but to connect them so that engineers can understand both resource pressure and its consequences for users.
Application Metrics Reveal Problems Infrastructure Dashboards Cannot See
Many serious production incidents occur while the underlying machines still appear healthy. A database connection pool can become exhausted even though the database server has spare CPU capacity. A message queue can grow continuously while every worker remains technically online. A Redis deployment can experience a falling hit ratio that silently redirects enormous volumes of traffic toward the primary database.
For APIs, useful measurements usually include request volume, error rate, response status distribution, timeouts, retries, and latency percentiles for individual endpoints. Breaking these measurements down by endpoint and service is important because a global latency number can remain healthy while one critical workflow becomes unusable.
Database monitoring requires similar granularity. Query latency, active connections, connection pool utilization, locks, slow queries, replication lag, read and write throughput, and storage growth can all become significant as traffic increases. These measurements complement the techniques covered in our database scaling guide. Replication, for example, increases read capacity but introduces replication lag as an additional operational concern. A replica can remain online and appear technically healthy while gradually serving increasingly stale information.
Caching layers also require dedicated monitoring. Cache hit and miss ratios, memory consumption, evictions, latency, connections, and errors help teams understand whether the cache is actually reducing backend load. This is particularly important for the caching strategies used in high-load systems, because a cache that stops being effective can transfer a large volume of previously absorbed requests directly to databases and downstream services.
Queues introduce another set of operational signals. Queue depth is useful, but it becomes much more meaningful when combined with message age, producer rate, consumer throughput, retries, failed jobs, and dead-letter queues. A queue containing 100,000 messages may be perfectly healthy if consumers are processing them faster than producers create them, whereas a queue containing only several thousand messages may indicate a serious problem if it continues growing and the oldest message has been waiting for an hour.
Metrics Show the Pattern, While Logs Explain the Event
Metrics are extremely efficient because they compress enormous amounts of system activity into time-series data that can be visualized and analyzed. That compression is also their limitation. A graph can show that the error rate increased from 0.2 percent to 7 percent at a particular moment, but it cannot necessarily explain which exception occurred or which request triggered it.
Logs preserve this contextual information. Application logs can record exceptions, dependency failures, authentication problems, deployment events, invalid states, database errors, and other details that help engineers reconstruct what happened around an incident.
As log volume grows, however, traditional free-form text becomes increasingly difficult to work with. Structured logging provides a more scalable approach by recording consistent fields such as timestamp, severity, environment, service name, endpoint, request ID, trace ID, duration, and error code. Engineers can then query specific combinations of events rather than manually reading enormous streams of text.
High-load systems also need to be selective about what they log. Recording every request payload, database operation, debug statement, and internal event can generate enormous storage costs while making important information harder to find. Production logging therefore requires decisions about log levels, retention periods, sampling, sensitive-data handling, and which events are genuinely useful during investigation.
The observability platform itself must be designed to scale with the application it monitors.
Distributed Tracing Shows Where Time Is Spent
Tracing becomes increasingly valuable once a single user request crosses multiple services. Consider a checkout request that takes three seconds to complete. Metrics can show that checkout latency increased, and logs may reveal several timeout messages, but a distributed trace can show that the API itself consumed only 120 milliseconds, Redis took another 30 milliseconds, the database required 170 milliseconds, and an external payment provider accounted for more than two seconds.
That information changes the investigation immediately because engineers no longer need to guess which service is responsible.
OpenTelemetry provides a vendor-neutral approach to generating and collecting telemetry, including traces, metrics, and logs. This allows teams to instrument their applications without making the instrumentation itself completely dependent on a single observability vendor.
Tracing is particularly useful for the distributed architectures discussed in our high-load backend development guide. As the number of services, queues, databases, and dependencies increases, the ability to follow an individual request through the architecture becomes increasingly important during incident response.
Prometheus and Grafana as the Foundation of a Monitoring Stack
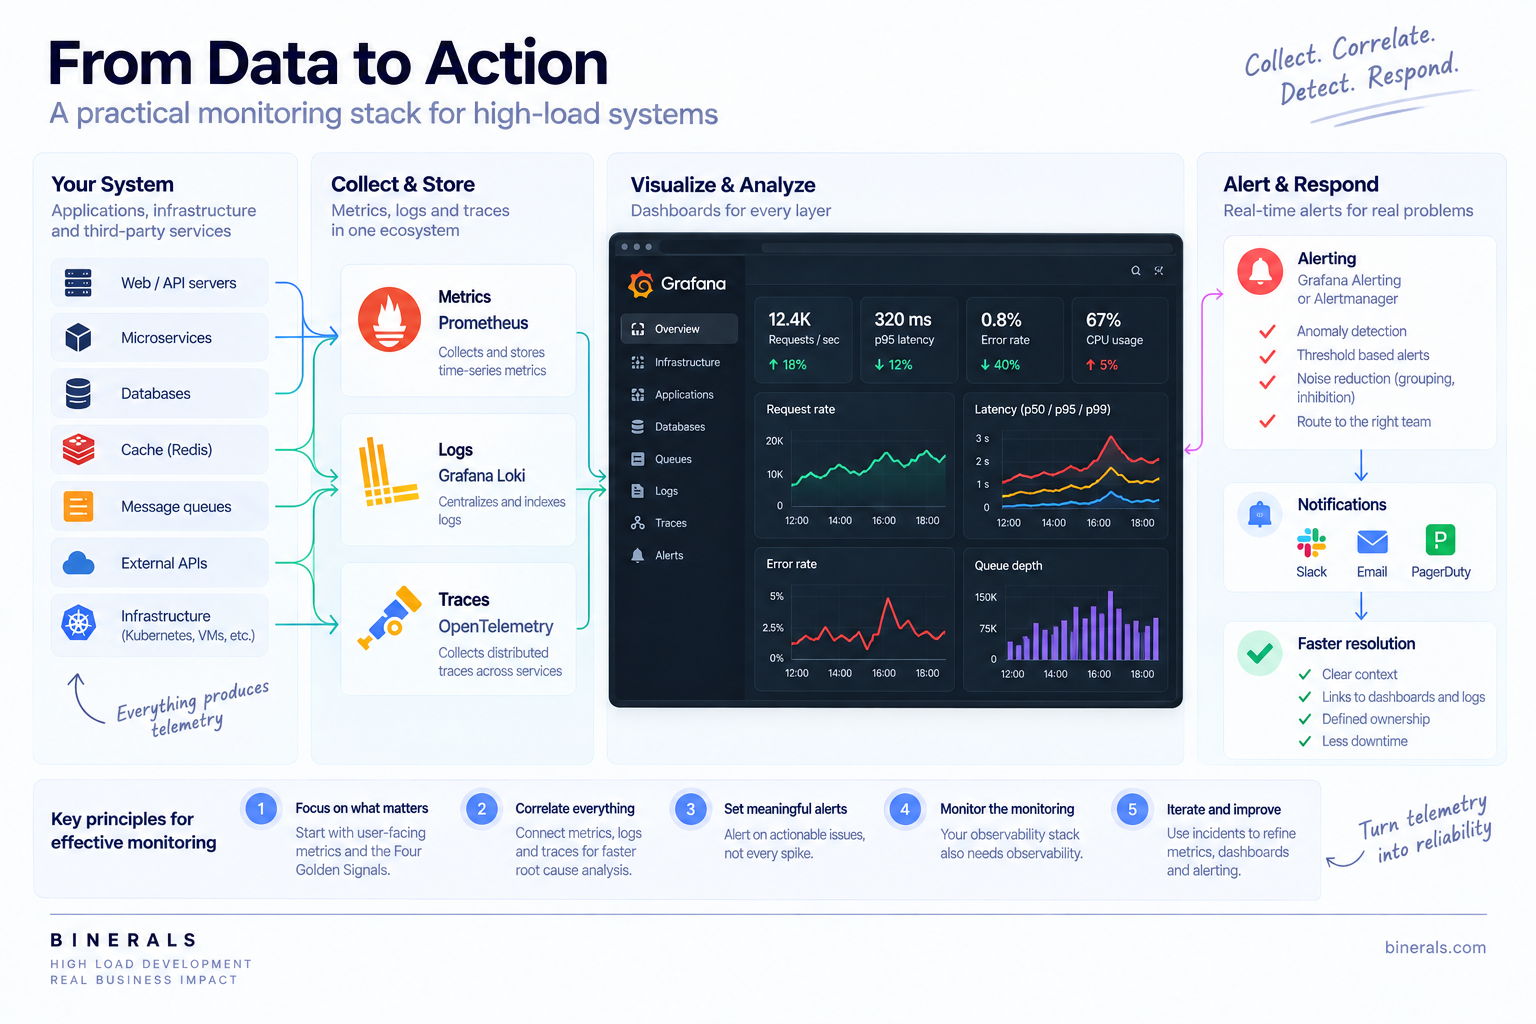
There is no single monitoring stack that every high-load application should use. Infrastructure, cloud provider, team expertise, compliance requirements, and operational budgets all influence the decision. Nevertheless, Prometheus and Grafana have become a common combination because they provide a flexible way to collect, query, visualize, and alert on time-series metrics.
Prometheus Turns System Behavior Into Queryable Time-Series Data
Prometheus collects metrics exposed by applications and infrastructure components and stores them as time-series data. These measurements can represent request counts, latency distributions, memory utilization, database connections, cache behavior, queue depth, or practically any other numeric signal that engineers need to observe over time.
PromQL then allows teams to calculate rates, aggregate measurements, compare services, evaluate percentiles, and create alert conditions. This is particularly useful in environments where infrastructure changes frequently because operational visibility does not have to depend on manually inspecting individual servers.
The value of Prometheus is therefore not simply that it collects metrics. Its larger contribution is creating a consistent model through which system behavior can be measured and queried across many components.
Grafana Turns Telemetry Into Operational Context
Grafana sits naturally on top of Prometheus and other data sources because it allows teams to turn raw telemetry into dashboards designed around operational questions.
A high-load overview dashboard might combine traffic volume, p50, p95, and p99 latency, error rates, availability, CPU and memory utilization, database connections, replication lag, cache hit ratio, and queue processing delay. More specialized dashboards can then provide deeper views for databases, infrastructure, individual services, or incident response.
The important design principle is that a dashboard should help an engineer understand the state of the system quickly. Filling one screen with dozens of unrelated graphs may technically expose more data while providing less useful information during an incident.
Logs Can Be Centralized Alongside Metrics
Grafana Loki is commonly used alongside Grafana to aggregate and query logs. This enables a useful operational workflow in which an engineer first notices a latency or error spike on a metric dashboard and then investigates logs from the affected service and time period without switching between disconnected monitoring environments.
The observability stack itself also needs monitoring. Grafana's Loki documentation explicitly describes meta-monitoring because a production log platform can experience its own resource constraints and failures. A monitoring system that becomes unavailable during the same traffic spike that affects the application provides little operational value precisely when engineers need it most.
Cloud-Native Platforms May Be a Better Fit for Some Architectures
Teams heavily invested in a particular cloud ecosystem may prefer native monitoring services. Amazon CloudWatch, for example, collects metrics from AWS services, supports custom application metrics, centralizes logs, provides dashboards, and can evaluate alarms continuously against configured conditions.
The decision between Prometheus, Grafana, cloud-native tooling, commercial observability platforms, or a combination of them should be driven by architecture and operational requirements rather than by popularity. Regardless of the specific products chosen, the objective remains consistent: telemetry needs to be collected reliably, correlated across components, and available quickly when the system begins behaving abnormally.
When a distributed system becomes difficult to understand in production, Binerals can help build an observability layer that connects infrastructure, applications, databases, caches, and user-facing performance.
Contact usReal-Time Alerts Should Identify Problems That Require Action
Dashboards are useful only while someone is looking at them. A production environment therefore needs alerting capable of detecting significant conditions automatically and notifying the people responsible for responding.
The difficult part is deciding which conditions actually deserve an alert. Creating a notification whenever any metric crosses a threshold quickly produces an environment where engineers receive so many messages that they stop treating them as meaningful.
Grafana's alerting guidance recommends prioritizing user-facing symptoms such as elevated latency, errors, and availability problems when deciding which conditions should page engineers. Internal infrastructure events remain valuable diagnostic signals, but not every CPU spike, pod restart, or temporary resource fluctuation requires immediate human intervention.
An alert that simply states that CPU exceeded 80 percent provides relatively little operational context. An alert explaining that checkout p99 latency has remained above two seconds for ten minutes while the error rate exceeds three percent describes a condition much closer to actual user impact.
This does not mean infrastructure alerts should disappear. A rapidly filling disk, exhausted database connection pool, growing queue, or memory leak can provide valuable warning before users experience a failure. The distinction is that alerts should correspond to conditions that someone can reasonably investigate or act upon.
Alert Thresholds Need to Reflect Real System Behavior
Universal thresholds rarely work well across different systems. A service that routinely operates at 70 percent CPU may remain completely healthy at 85 percent, while another service that normally uses 15 percent may have experienced a major regression when it suddenly reaches 60 percent.
Historical telemetry should therefore be used to establish baselines for normal behavior. The same principle applies to latency, memory, queue depth, error rates, and other operational signals. Grafana's alerting guidance recommends choosing thresholds based on observed system behavior rather than applying arbitrary values without context.
Alerts should also account for duration. High-load environments naturally experience temporary fluctuations, and a short CPU or latency spike does not necessarily justify intervention. Requiring a condition to remain abnormal for an appropriate period helps distinguish sustained degradation from harmless noise.
Alert Fatigue Can Become a Reliability Problem of Its Own
An alerting system that generates hundreds of irrelevant notifications does not make an organization safer. Instead, it teaches engineers that alerts are usually unimportant. Once that happens, the genuinely critical notification becomes easier to miss.
Useful production alerts should provide enough context for the responder to understand what happened, which service or workflow is affected, how severe the impact appears to be, and where investigation should begin. Grafana recommends giving alerts clear ownership and linking them to relevant dashboards and runbooks so responders can move directly from notification to diagnosis.
Related alerts should also be grouped whenever possible. A database failure can cause API errors, worker failures, growing queues, failed background jobs, and connection errors across multiple services. Sending a separate notification for every downstream symptom can overwhelm the team during an already difficult incident.
Prometheus Alertmanager addresses this problem through grouping and inhibition. Related alerts can be combined into consolidated notifications, while secondary alerts can be suppressed when a more fundamental failure is already known to be active. This reduces noise and helps incident responders concentrate on the root problem instead of navigating a flood of duplicate symptoms.
Severity levels should follow the same principle. Critical alerts should correspond to immediate user impact or a serious risk of outage, while warnings can identify degradation that requires investigation without necessarily demanding an immediate response. Lower-severity operational information may be more useful in dashboards and incident history than in a notification channel.
SLOs Connect Monitoring to Actual Reliability
As monitoring practices mature, teams can move beyond evaluating isolated technical thresholds and begin measuring whether the service is meeting explicit reliability objectives.
A product might define that 99.9 percent of requests must succeed, that 95 percent of checkout operations should complete within 500 milliseconds, or that an API should remain available for 99.95 percent of a given period. These expectations become Service Level Objectives, or SLOs.
This changes the way teams interpret telemetry. Instead of reacting every time CPU crosses an arbitrary threshold, engineers can evaluate whether technical behavior is consuming the service's allowed error budget quickly enough to threaten the reliability target.
Infrastructure metrics remain essential because they help diagnose why an SLO is at risk. The SLO, however, provides a clearer definition of when technical degradation becomes significant from the user's perspective.
For high-load systems, this is an important evolution because it connects operational monitoring to the level of service the business actually intends to provide.
Building a Monitoring Architecture That Scales With the Product
A mature observability environment can be viewed as a pipeline that begins with applications and infrastructure, continues through instrumentation and telemetry collection, stores metrics, logs, and traces, and eventually presents that information through dashboards, alerts, notifications, and incident-response workflows.
The architecture of this pipeline matters because observability infrastructure is exposed to many of the same scaling pressures as the product itself. Higher application traffic creates more metrics, more traces, and potentially far more logs. If the monitoring platform cannot absorb that growth, teams may lose visibility during precisely the events they most need to investigate.
A practical implementation usually starts with the critical user path rather than attempting to instrument everything immediately. Teams can first measure traffic, latency, failures, dependencies, and resource utilization for business-critical workflows, then establish baselines that describe normal behavior. Once those baselines exist, dashboards can be designed around specific operational questions instead of simply displaying every available measurement.
Correlation should be introduced early as well. Consistent request IDs and trace IDs allow engineers to move from a metric anomaly to relevant logs and traces, dramatically reducing the amount of manual investigation required in distributed environments.
Alerting should then be layered on top of this visibility. Availability, user-facing latency, error rates, capacity risks, and critical business workflows usually deserve the highest priority, while lower-level infrastructure signals can provide early warnings where they are genuinely actionable. Every critical alert should have a clear owner and enough diagnostic context to begin investigation immediately.
The final step is continuous improvement. Every incident reveals something about the quality of the monitoring system. If users noticed the problem before the monitoring stack did, an important signal may be missing. If the alert fired but engineers could not identify the affected service, the telemetry may not be sufficiently correlated. If responders received dozens of redundant notifications, the alerting rules need refinement.
Monitoring therefore evolves alongside the system rather than being configured once and left unchanged.
A high-load platform should provide warning before capacity or reliability problems become outages
Talk to BineralsMonitoring Data Is Also a Foundation for Capacity Planning
Monitoring is commonly associated with incidents, but historical telemetry becomes equally valuable when planning future growth. A sufficiently long history of traffic, resource utilization, latency, database behavior, and queue performance reveals how the system responds as demand increases.
Suppose traffic has been growing consistently each month while database connection utilization approaches its practical limit during peak periods and p99 latency rises whenever request volume crosses a particular threshold. That information provides concrete evidence for deciding when to add replicas, expand cache capacity, increase worker pools, scale horizontally, or reconsider part of the architecture.
This makes capacity planning significantly more reliable than estimating future infrastructure requirements from theoretical limits alone. Teams can compare real traffic growth with real resource consumption and identify where additional demand is most likely to create the next bottleneck.
For high-load applications, this ability is especially valuable because major architectural changes are easier and less risky when they are made before the current system reaches its limit. Monitoring therefore does more than explain what happened yesterday. It helps teams understand what the architecture is likely to need tomorrow.
Conclusion
Operating a high-load system requires more than knowing whether its servers are online. As traffic grows and architectures become more distributed, reliability depends on understanding how infrastructure resources, application services, databases, caches, queues, dependencies, and user-facing performance interact with one another.
CPU, memory, disk, and network measurements reveal resource pressure, while latency, traffic, errors, and saturation describe how the system behaves under demand. Application-specific metrics expose bottlenecks that infrastructure dashboards cannot see. Logs provide the context behind individual failures, and distributed traces reveal where time is spent as requests move through multiple services. Tools such as Prometheus, Grafana, Loki, OpenTelemetry, and CloudWatch provide the technical mechanisms for collecting and analyzing this information, but the effectiveness of a monitoring strategy ultimately depends on which signals a team chooses to prioritize.
The same principle applies to alerting. More notifications do not create greater reliability. Alerts become valuable when they identify actionable conditions, reflect real system behavior, provide enough context for investigation, and reach the people capable of responding before degradation develops into a larger incident.
For this reason, observability should be considered part of high-load architecture from the beginning. A scalable system should not only continue operating as traffic grows. It should also make its own behavior understandable enough that engineers can see when it is approaching its limits, identify why performance is changing, and intervene before users become the monitoring system.